Reports
It represents the platform's business intelligence hub, providing users with a comprehensive and analytical view of operational performance. This tool enables administrators and supervisors to make data-driven decisions, optimize processes, and improve customer experience through detailed metrics and customizable reports.
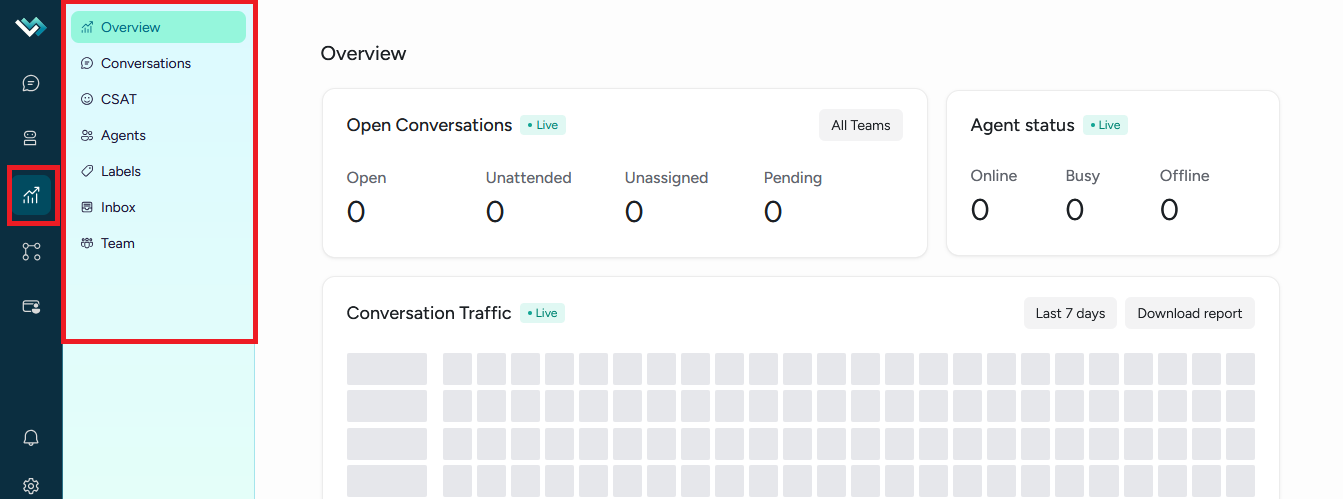
Main navigation panel
The section is structured in a hierarchically organized side menu that includes:
1. Summary Reports
Functionality: Real-time overview of operational performance
→ Components:
- Conversation metrics: Open, unanswered, unassigned, and pending conversations
- Traffic heat map: Visualization of conversation patterns by day and time
- Agent status: Distribution of online, busy, and offline agents
- Conversations by team: Metrics segmented by workgroup
2. Conversation reports
Functionality: Detailed analysis of conversation performance
→ Main metrics:
- Number of conversations: Total conversations processed
- Inbound/Outbound messages: Two-way communication volume
- First response time: Average time to initially respond
- Resolution time: Average time to close conversations
- Customer wait time: Average wait time between messages
- Number of resolutions: Total conversations resolved
3. Satisfaction reports
Feature: Customer satisfaction analysis
→ Specific metrics:
- Total responses: Number of completed surveys
- Satisfaction score: Percentage of positive responses
- Response rate: Percentage of survey participation
- Rating distribution: Breakdown by satisfaction level (1-5 stars)
- Advanced filters: By agent, tray, team, and specific rating
4. Agent reports
Feature: Individual agent performance evaluation
- Overview: List of agents with key metrics
- Detailed View: Deep analysis by specific agent
→ Metrics per agent:
- Assigned and resolved conversations
- Response and resolution times
- Volume of messages processed
- Operational efficiency
5. Tray reports
Feature: Performance analysis by communication channel
- Overview: Summary of all trays
- Detailed View: Specific metrics by Inbox
→ Metrics by Inbox:
- Conversations by channel (email, chat, WhatsApp, etc.)
- Response times by communication type
- Workload distribution
- Efficiency by channel
6. Team reports
Feature: Group performance analysis
- Overview: Summary of all teams
- Detailed view: Team-specific metrics
→ Metrics by Team:
- Conversations assigned to the team
- Collective response times
- Workload distribution
- Group efficiency
7. Tag reports
Feature: Categorization and classification analysis
→ Metrics by Tag:
- Tagged conversations
- Resolution times by category
- Query type distribution
- Classification trends
8. SLA reports
Feature: Service level agreement monitoring
→ Key Metrics:
- Compliance rate: Percentage of SLAs successfully met
- Number of violations: Total SLA violations
- Number of conversations: Total conversations with an applied SLA
- Advanced filters: By SLA policy, agent, inbox, team, and tags
- Detailed table: List of conversations with specific SLA events
9. Bot Reports
Feature: Automation performance analysis
→ Specific Metrics:
- Total conversations: Number of conversations handled by bots
- Total responses: Number of automated responses generated
- Resolution rate: Percentage of conversations resolved by bots
- Transfer rate: Percentage of conversations transferred to human agents
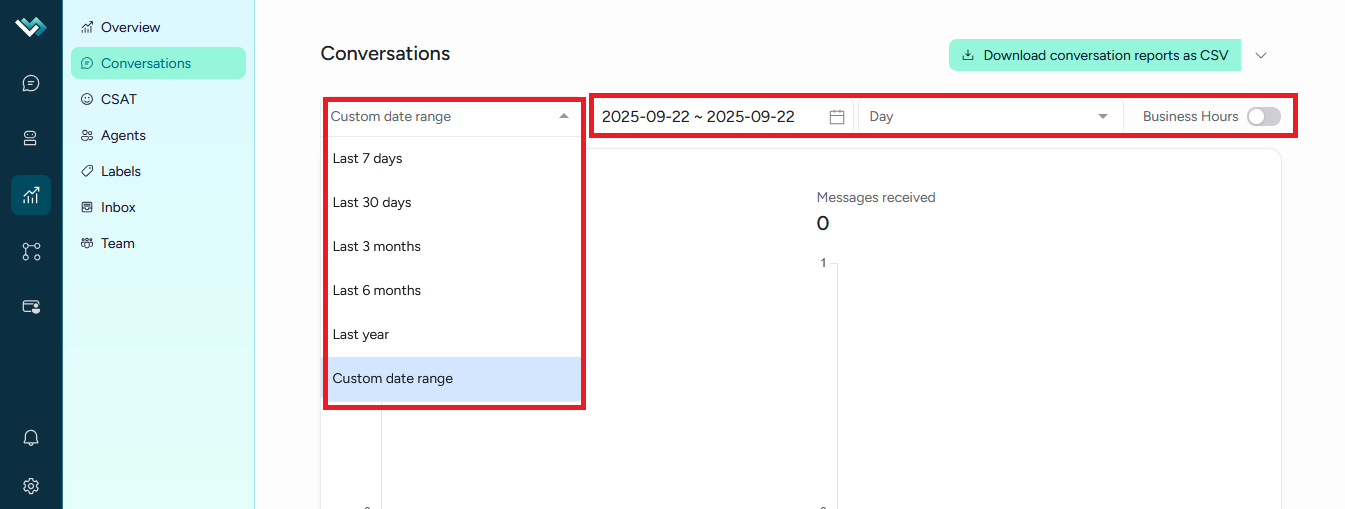
Filter and personalization system
Time filters
- Predefined ranges: Last 7 days, 30 days, 3 months, 6 months, 1 year
- Custom range: Select specific dates
- Business hours: Option to include/exclude business hours
Grouping filters
- By day: Detailed daily analysis
- By week: Weekly trends
- By month: Monthly analysis
- By year: Annual trends
Specific filters by report
- Agents: Select specific agents
- Trays: Filter by communication channels
- Teams: Analysis by workgroups
- Tags: Filter by categories
Download buttons
- Location: Header of each report section
- Format: CSV and Excel files for external analysis
- Content: Data filtered based on the current configuration
- Naming: Files with timestamp and report type
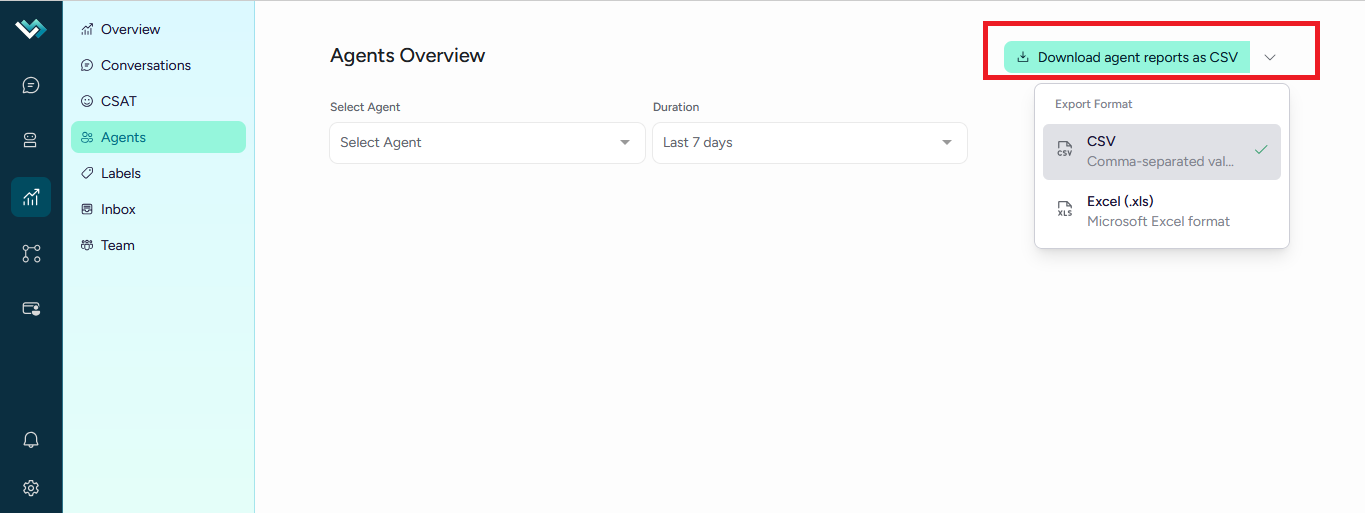
→ Action download

Advanced usability features
Real-time updates
- Live reports: Automatically updated data
- Status indicators: Visual update indicators
- Frequency: Updates every 30 seconds in live mode
Intuitive navigation
- Breadcrumbs: Clear navigation path
- Direct links: Quick access to specific conversations
- Active states: Visual indication of the current section
This reports section provides LBdesk with robust analytical capabilities that allow organizations to optimize their customer service operations, identify opportunities for improvement, and maintain high standards of service quality.